READ BY CHAPTER
Being the Change: Live Well and Spark a Climate Revolution
9. Leaving Fossil Fuel
More of my nights are in a plane than in a bed, maybe even counting hotels.
—Tom Stuker, first consumer to fly a million miles in a yea
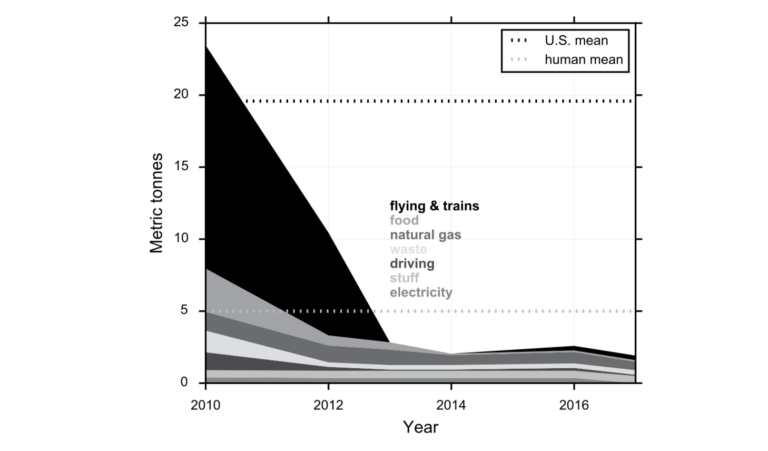
So far, by making changes to my daily life, I’ve reduced my emis- sions by more than a factor of ten. I used to emit slightly more greenhouse gases than the average American. Now I emit less than the average human (see Figure 9.1). However, I still emit nearly twice the average Bangladeshi,1 and infinitely more than a wild, nonhuman Earthling.
This level of reduction, while incomplete, allows my family and me to continue a normal suburban life. This suggests that a similar reduction is well within reach for many of us. And as more people make significant reductions, and systemic alternatives to fossil fuel become increasingly available, going the rest of the way will become easier.
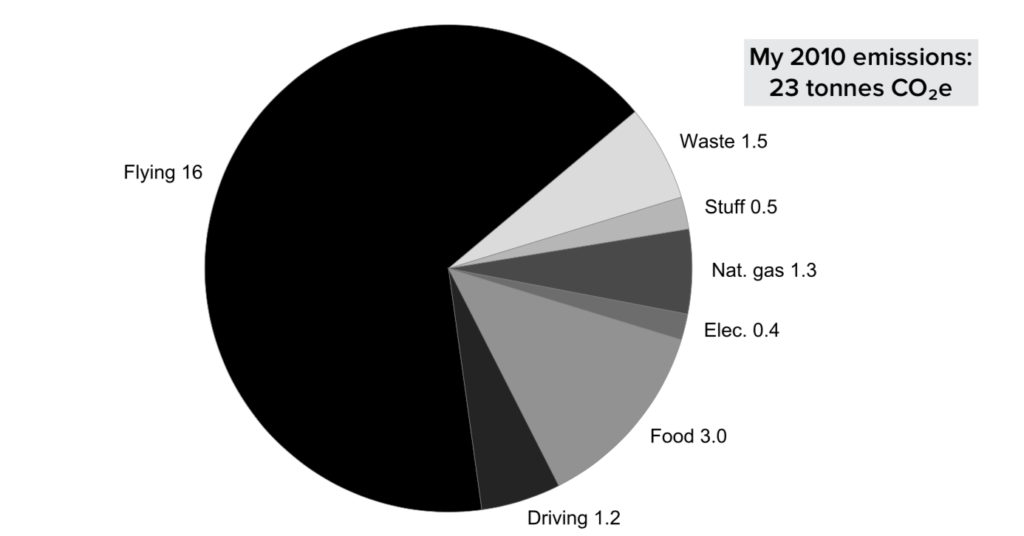
To accomplish my reduction, I first had to understand the sources of my climate impact. Basic quantification enabled me to address the biggest sources first. Figure 9.2 shows my estimated emissions of greenhouse gases for 2010. Air travel dominated everything else, but I’d been entirely unaware of this! The simple act of quantification shattered my preconceptions and shined a bright light onto my ignorance.
Quantification allowed me to develop awareness of my daily actions, which was a prerequisite to changing them. Gradually, I’ve become more aware of what I’m doing in any given moment, and how my actions affect other beings. Daily life is a series of choices; in US society, many of these choices lead to fossil fuels. Finding alternatives requires creativity. For me, it has felt like a fun and engaging game.
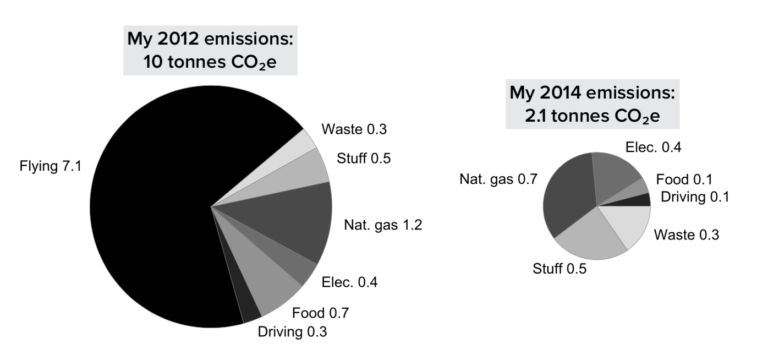
Figure 9.2 also shows my 2012 and 2014 emissions. As I ramped down flying, I also reduced my emissions from food, waste, and driving. I became vegetarian, started growing food, and began obtaining much of my food from the waste stream (freeganism). I started composting aggressively, and biking became my primary mode of transportation.
Why reduce in the first place?
Some people see no value in personal reductions. They haven’t cut their own emissions, and they justify their inaction by assuming individual-level reductions don’t make any difference. They assume that it requires too much sacrifice. None of this has been true in my experience.
Perhaps surprisingly, my main motivation for reducing was not to keep my own emissions out of the atmosphere. One person’s reduction is a tiny drop in a vast ocean of human greenhouse gas emissions. If directly reducing global emissions were my main motivation, I’d find it depressing, like trying to save the world all by myself. Instead, I reduce for three much better reasons.
First, I enjoy living with less fossil fuel. I love biking, I love growing food, and I love being at home with my family instead of away at conferences. Less fossil fuel has meant more connection with the land, with food, with family and friends, and with community. If through some magic spell, global warming were to suddenly and completely vanish, I’d continue living with far less fossil fuel.2
Second, by moving away from fossil fuel, I’m aligning my actions with my principles. Burning fossil fuel with the knowledge of the harm it causes creates cognitive dissonance, which can lead to feelings of guilt, panic, or depression. Others might respond to this cognitive dissonance with cynicism, or perhaps by denying that fossil fuels are harmful. But I find that a better option is simply to align action to principle.
Finally, I believe personal reduction does help, indirectly, by shift- ing the culture. I’ve had countless discussions about the changes I’ve made, and I’ve seen many people around me begin to make similar changes in their own lives. By changing ourselves, we help others envision change. We gradually shift cultural norms.
The essential story I’m telling is that life can be better without fossil fuel. I’ve experienced this to be true; if others also experience this to be true, who’s to say the story won’t develop a powerful, change-making resonance?
Of course, there’s no reason to limit our actions to the personal sphere. I find that actions aimed at the personal and actions aimed at the collective are mutually reinforcing. I see no reason not to do both.
Making the estimates
This section gives the details behind my estimates as well as the tools you need to assess your own situation. But first, a few general considerations.
Your emissions profile will not look like mine
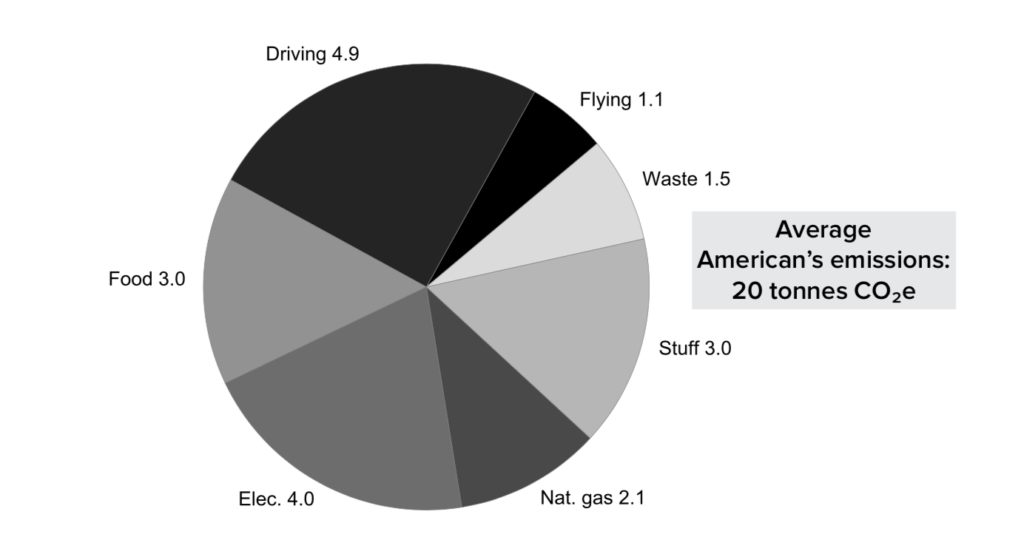
The average US citizen’s emissions profile (Figure 9.2) looks nothing like my 2010 profile. Your emissions profile is likely also unique. Your life is different from mine, and you must understand the idiosyncrasies of your own situation before you can take meaningful action.
Some actions are bigger than others
These days, there are lots of suggestions for how we can “save the planet,” but very little about their relative effectiveness. This lack of distinction paves the way for greenwash (for example, airports “going green”). Lack of quantification also kept me from realizing the impact of my flying, despite my deep concern over global warming.
Not everyone’s emissions will be as dominated by flying as mine were. Many US citizens don’t fly at all, so national average emissions from flying are low. Someone close to this average profile—whose major emissions are from driving, new stuff, electricity, and food—should naturally focus on things like bicycling, living close to work, buying less stuff, sourcing renewable electricity, and eating less meat.
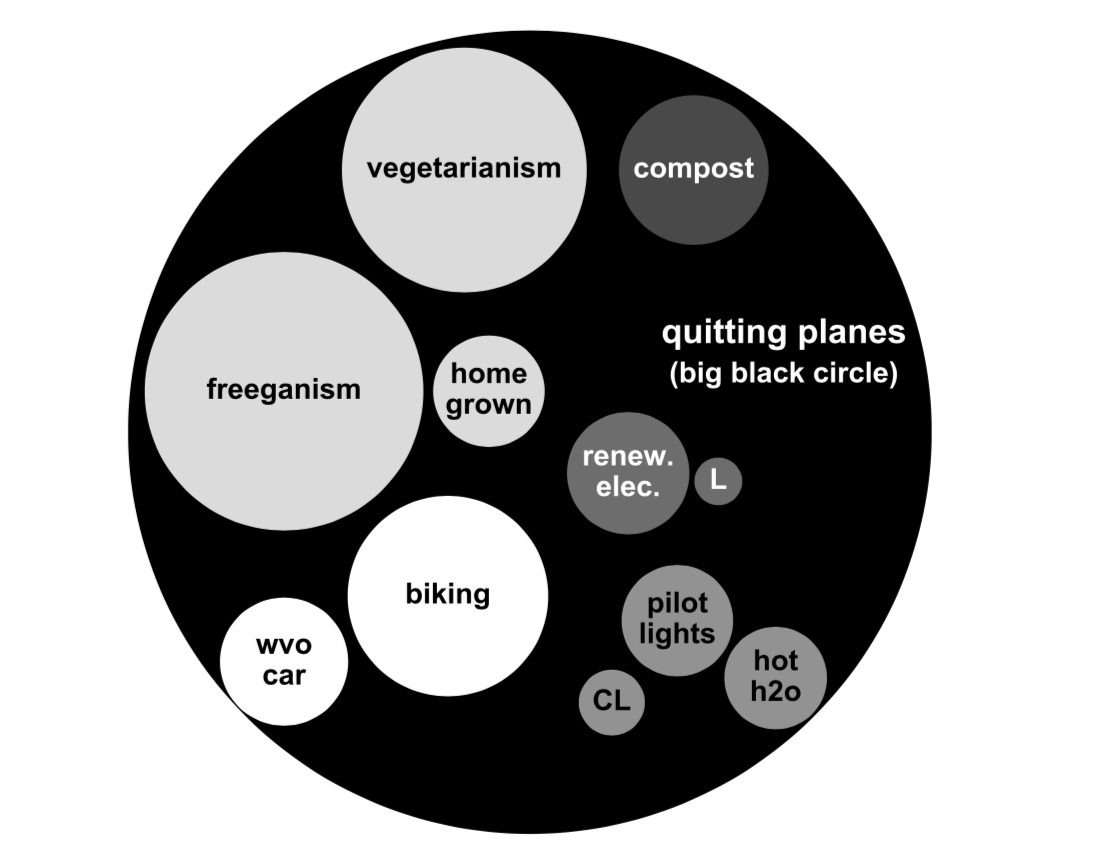
I’ve represented estimates of the relative reductions from my major actions in Figure 9.3. My five most effective actions were quitting planes, vegetarianism, bicycling, freeganism, and composting. This is such an important point—that not all actions are equal in terms of emissions reductions—that I’ve also tabulated the estimates in Table 9.1.
Physics bats last
Our predicament consists of many interconnected processes, systems, and mindsets. It’s larger than global warming. Being locked into the old story of separation and amplification of our egos (by reacting automatically with craving and aversion) underlies much of this. Therefore, anything we do to counter these bad mental habits and to build a more beautiful world helps at some level.3 For example, the moment in which we observe an impulse to say something negative—and we stop ourselves—is a wonderful moment. So is the moment in which we help another without expecting anything in return. However, the fact remains that humanity urgently needs to stop burning fossil fuels. Photons interacting with the atmosphere don’t respond to our acts of kindness; they only respond to our acts of greenhouse gas emission. An appropriate response to our predicament, then, must also include actions that target emissions. These concrete, focused actions, taken by enough individuals to create cultural shift, will begin to change the systems and institutions that lead us to mindlessly burn huge amounts of fossil fuels in our daily lives. One of the most effective actions any of us can take as an individual is to radically reduce our own fossil fuel use. Doing this even caused my advocacy for collective action to be- come more resonant and powerful.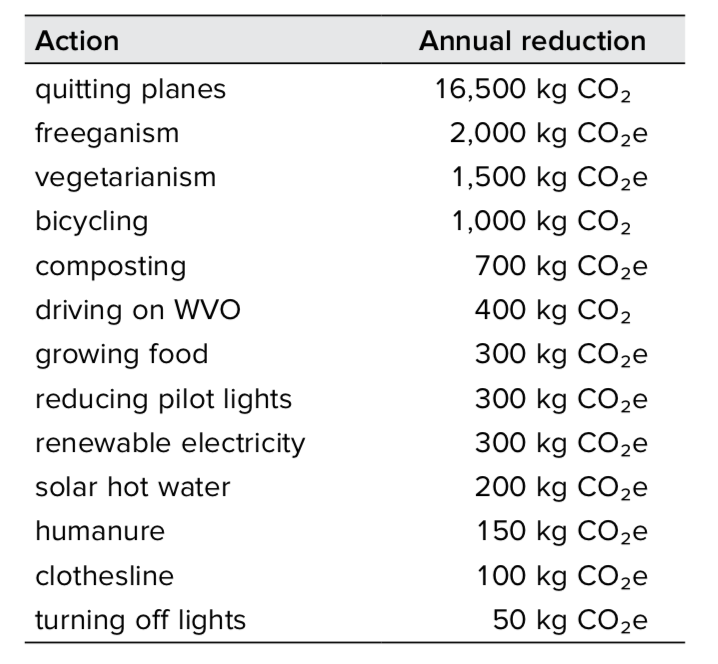

Let’s dive in
The yardstick we’ll use for measuring climate impact is kilograms (kg) or metric tonnes (1 tonne = 1,000 kg) of CO2-equivalents (CO2e). As discussed in Chapter 3, climate impact from other sources (such as methane) is converted into CO2e, a greenhouse- effect-equivalent amount of CO2, for apples-to-apples comparison.
Table 9.2 gives conversion factors from daily life units to CO2e amounts.4 (I’ll explain how I came up with them below.) These estimates include the “upstream” emissions generated from obtaining and processing the fuels, which add an additional 20% or so5 beyond what’s emitted by burning the end product. Note that upstream emissions are rising as we increasingly turn to energy- intensive production methods like fracking, deep offshore drilling, and tar sands extraction.
Air travel
Hour for hour, the quickest way a normal human can warm the planet is by flying on a commercial plane. Airplanes contribute to global warming via CO2 emissions, NOx emissions,6 contrails, and cirrus cloud formation (Figure 9.4). High icy clouds such as contrails and cirrus let the sun through but trap outgoing thermal radiation from the ground, warming the planet.
The global warming contribution from the average plane’s CO2 emissions alone is 0.3 kg CO2 per passenger mile.7 That’s for coach; first-class or business-class fliers are responsible for twice these rates of emissions, as they take up over twice the space on a plane.8 Then, the non-CO2 effects likely double or triple the global warming potential of airplanes.9 Unlike CO2, these effects are short-term: if planes suddenly stopped flying, they’d disappear within days.
The act of flying is an exercise of privilege. Globally, only about 5% of humans have ever flown.10 The average American emits about 1,000 kg CO211 per year from flying,12 which is roughly equivalent to one 4,000-mile round-trip between Los Angeles and Chicago. In 2010, however, I flew 50,000 miles, equivalent to two transatlantic and six domestic flights. My flights that year resulted in 16 metric tonnes of CO2.
Academics are expected to fly to universities and conferences to talk about their research. This provides visibility for job offers and funding. Many of my friends and colleagues fly more than 100,000 miles per year; climate scientists fly just as much as astro- physicists (and other academics). There’s little interest in teleconferencing.
Nonetheless, flying in commercial planes began to feel increasingly unwholesome to me.13 I gradually ramped down my air travel as it dawned on me that the benefits to my career weren’t worth the negative consequences.14 Who would pay the real cost of my flights? I decided I couldn’t justify putting my career over the biosphere. I imagined my kids someday saying, “Dad, how could you keep flying around the world giving 20-minute updates on your research when you knew the impact?” They would be right to ask this.
I now prefer slow and adventurous travel to fast travel. By not flying all the time, I’m able to connect much more deeply to my local community, which is satisfying. Nor do I miss the jet-setting life: the hotels, the homesickness, the airport lines, the jet lag, and the colds I’d often catch on planes. (Indeed, modern air travel is the ideal way for a local outbreak to spread into a pandemic.)
I decided to only include the long-term CO2 portion of air- plane impact in the above pie charts, which makes airplanes look much better than they really are. But either way, the basic conclusion was inescapable: reducing my emissions would require flying less.
Car travel
My largest climate impact was from flying, but the average American’s largest climate impact is from driving. In the US, the average person emits about 5,000 kg CO2 per year from driving.15 A map of any city’s CO2 emissions looks exactly like a map of that city’s expressways (or as Sharon calls them, petrol deathways16).
Here we’re only considering the impact from fuel—burning a gallon of gas emits 11.3 kg CO2, while burning a gallon of diesel emits 12.1 kg CO217—but keep in mind that driving requires roads, bridges, parking, and the cars and trucks themselves, the creation of which also produces emissions.
In 2010, Sharon and I burned 330 gallons of gas to drive a 45 mpg gasoline car about 15,000 miles. I’ll claim 1/3 of these emissions (1,200 kg CO2), a guess, attributing the rest to Sharon and our sons.
Since 2011, most of my driving has been in Maeby, a 1984 diesel Mercedes-Benz fueled by waste vegetable oil (WVO). Burning plant oil doesn’t increase the net CO2 in the atmosphere. The plants capture CO2 from the atmosphere to make the oil, and burning the oil releases that same CO2 back to the atmosphere for no net gain.18
Maeby is useful for hauling heavy or bulky materials or for traveling great distances. However, for trips of fewer than ten miles, I prefer riding my bike. Biking is more fun, which is saying something, as I still get a thrill when I flip the two switches on my dash- board that take Maeby from diesel to veg.
Maeby requires a cup of diesel to warm up before switching to WVO. In 2012, my personal use of diesel fuel in Maeby came out to 13 gallons (I kept a log for three months, then multiplied by four). In addition, I burned about 10 gallons of gasoline in other cars for a total of 300 kg CO2. In 2013, my portion was three gal- lons of diesel and two gallons of gas, for total estimated emissions of 50 kg CO2. The improvement came from more biking and less driving.
Switching from fossil fuel to WVO eliminated 400 kg CO2 per year. But biking reduced my annual emissions by 1,000 kg CO2 as it became my primary mode of transportation.19
Methane, also known as “natural gas”
Natural gas is often touted as a bridge fuel, a clean pathway for transitioning from fossil fuels to renewables. This is because natural gas emits only half as much CO2 as coal on an energy- equivalent basis.
However, natural gas also leaks into the air at every step in its life cycle, and it’s a far more potent greenhouse gas than CO2. As gas leaks from wells, pipelines, processing plants, and the 100-year-old cast-iron pipes under our streets,20 it contributes significantly to global warming.
After refining, natural gas is essentially 100% methane,21 and the global warming potential (GWP) of methane is about 105 and 33 times that of CO2 on 20-year and 100- year time horizons, respectively.22 Here, I’ll use the average value of the 20- and 100-year time horizons, assigning 1 kg of methane a GWP of 65 kg CO2e.23
At a GWP of 65, methane leakage of 4% or more would make natural gas worse than coal in terms of climate change.24 A 2011 study by Howarth et al. estimated total leakage at between 3.6% and 7.9% for gas produced by fracking and 1.7% and 6% for conventional gas.25 Subsequent airborne measurements over Uintah County, Utah, estimated leakage at between 6.2% and 11.7% of production.26 Because of this leakage, an energy system built on natural gas might well be worse for the climate than one built on coal. Meanwhile, energy utilities and municipalities in the US are scrambling to transition to natural gas, because they mistakenly view it as the “green fossil fuel.” In terms of global warming, this is a mistake.
A major regulatory overhaul of natural gas drilling operations
combined with a major infrastructure overhaul could eliminate some of the leaks. However, to be meaningful, this overhaul would need to include the old pipes running under our streets, and this would be extremely expensive: laid end to end, the natural gas pipe in the US alone would stretch to and from the moon almost three times.27 Perhaps we’d be wiser to leave natural gas and gas appliances behind as quickly as possible, replacing them with carbon- free electricity instead.
Burning a therm of natural gas emits 5.3 kg CO2; including the upstream emissions bumps this amount to 6.1 kg CO2. To account for leakage, and since half of the gas consumed in the US is fracked, we can use the mean of the Howarth et al. ranges (5% methane leakage). This translates into an additional 6.5 kg CO2e from methane leakage per therm of natural gas,28 for total emissions of 13 kg CO2e per therm. The average American emits 2,000 kg CO2e per year from residential natural gas.29
When we first moved into our house in 2008, there were five pilot lights emitting a whopping 1,600 kg CO2e per year. We shouldn’t still be using pilot lights in an age of global warming! Eliminating two stove pilot lights cut 600 kg CO2e, and turning down the rest (oven, space heater, water heater) cut an additional 300 kg CO2.
In 2012, we used 372 therms of natural gas—4,400 kg CO2e— for heat, cooking, hot water, and drying clothes. We then switched to using a clothesline, which reduced our household CO2e emissions by 550 kg.
In 2016, our old gas water heater died, and I decided to replace it with a solar hot water heater. This reduced our household emissions by about 800 kg CO2e per year (most households would see a larger reduction30), but it was expensive at $4,000.31 I could go further down this route, replacing our old gas heater with an electric heat pump for around $5,000, and replacing our gas range and oven with an electric induction range and convection oven for $2,000.
These electrical devices would require upgrading our home’s outdated electrical wiring and service, which I expect would cost more than $7,000. For a total of $18,000, we could eliminate 2,500 kg CO2e in natural gas emissions per year. All this new stuff would have roughly 12,000 kg CO2e in embodied emissions (see below, and realize that the water heater had a rebate), so the emissions payback time, if running on renewable electricity, would be five years—not terrible, but not great, either. But we can’t afford all this. And for us, it wouldn’t even make sense from an annual operating cost perspective.
Food
My second-largest climate impact came from food. This was an- other big surprise, revealed to me only by looking at the numbers. Growing, processing, packaging, and distributing food pro- duces greenhouse gases: CO2 from fuels, fertilizer production and land-use changes such as deforestation; nitrous oxide (N2O) from fertilizer production and application;32 and methane from livestock. About 1/3 of global greenhouse gas emissions are due to food production,33 and about 1/2 of this (15% of global emissions) is due to livestock,34 mainly cows.
Your individual emissions from food production naturally depend on your diet—what you eat, how much you eat, and how your food gets to your plate. Producing the food for typical meat, vegetarian, and vegan diets emits about 3,000, 1,500, and 1,000 kg CO2e per year, respectively.35 The average American diet emits 2,900 kg CO2e per year, slightly less than the average meat diet, since 3% of Americans are vegetarian (about half of whom are vegan).36
In 2012, I stopped eating meat primarily to avoid harming animals, and I personally prefer vegetarianism. In addition, it reduced my emissions by about 1,500 kg CO2e per year. Over the next few years, I began growing food, trading surpluses with neighbors, and rescuing supermarket discards (freeganism). Most of my food now comes from these sources. I estimate that freeganism alone reduces my food emissions by an additional 1,000 kg CO2e per year.37
Electricity
You wouldn’t dream of leaving your water taps wide open when you’re not using them; I feel the same way about electricity. Electricity is precious.
Emissions from electricity depend on the method of generation. If your electricity is sourced from 100% renewables, then you have no electricity emissions. Otherwise, generating electricity in the US emits 0.9 kg CO2e per kWh on average.38
The typical American consumes 4,300 kWh of residential elec- tricity per year, emitting 4,000 kg CO2e.39 In our house, we some- how use less than 1/10 of this per person. We don’t have a TV or air conditioner, and we’re careful to turn things off, but otherwise we use electricity liberally. I suspect that much residential electricity in the US is simply wasted, and that it would be quite possible to cut our national consumption by 1/2 or more without real sacrifice.
Rooftop solar probably makes sense for most 11,000 kWh-per- year households, but at our annual usage of only 1,200 kWh, it’s not yet cost-effective. Leasing isn’t an option for such a small system. But in 2016, SoCal Edison finally offered us a 100% renewable option. This will cost our household an additional $50 per year,40 a far better deal for us than rooftop solar.41 Before this option, my share of our household emissions came to 300 kg CO2e per year; afterwards, of course, it dropped to zero. I suspect SCE is responding to growing demand for community choice aggregation, an exciting strategy for switching entire regions to 100% renew- able electricity, building community, and raising climate awareness (see Chapter 15).
Stuff
Manufacturing new stuff—cars, clothes, computers, furniture, and so on—emits greenhouse gases. Estimating these emissions rigorously would be quite complicated, but for our purposes, a simple rule of thumb will suffice: each dollar spent on new stuff represents roughly 0.5 kg embodied CO2e emissions (counting manufacturing, packaging, and shipping).42
The average US person spends a little over $6,000 per year on new stuff.43 (Remarkably, 1/3 of this goes toward new cars,44 another measure of the automobile’s dominance in our lives.) Therefore, average emissions are something like 3,000 kg CO2e. My wife and I both prefer not having much stuff; our four-person household spends about $4,000 per year on goods (clothes, books, hardware, stuff from Target, etc.) My portion of these emissions is 500 kg CO2e.
These estimates don’t include housing. Building a modest two-bedroom house with modern industrial methods produces some 80 tonnes CO2e.45 We could divide emissions from long- lived items by the item’s lifetime to get annualized emissions. Our bungalow was built in 1926, and if it lasts another 60 years, we could assign 100 kg per year for each of the four people in my family. However, distributing the emissions in this simplistic way is clearly not right, because it doesn’t distinguish between buying new versus used. A careful accounting of such long-lived purchases should assign more emissions to the earliest years.
Waste
When we send our stuff to the landfill,46 the organics—food waste, yard waste, paper, and textiles—decompose anaerobically (with- out oxygen), producing methane. US landfills emit 1,300 kg CO2e per person per year.47 Let this sink in for a moment: our society has reached a point where even one person’s trash, taken by itself, generates more CO2e than the average Bangladeshi generates for everything.48
Sewage treatment plants in the US generate an additional 150 kg CO2e per person annually, due to the anaerobic decomposition of your “personal waste,” along with waste from industrial meat production; and also due to the electricity required to run the industrial-scale processing plants.49
This analysis highlights the need for change at the systems level: as a society, we should never, ever put organic material into landfills. It also highlights the interconnection between our food and waste systems, which I’ve begun thinking of as one integrated system. For example, two-thirds of food waste occur before the supermarket checkout line; as an individual, you have no control over that methane-emitting waste except by opting out of the industrial food system (see Chapter 13).
Still, composting is a wonderful practice. If you have a yard, you can safely compost your food waste, yard waste, and human waste (Chapter 12). This eliminates some of these waste emissions since backyard piles decompose aerobically, emitting CO2 instead of methane. Humanure cuts up to 150 kg CO2e of sewage treatment emissions, and composting food scraps and yard waste cuts another 400 kg CO2e.50
However, this means that, even if you compost aggressively, your landfill waste is still emitting 900 kg CO2e. On average in the US, 1/3 of this comes from the pre-consumer food waste I’ve already mentioned, 1/3 comes from non-recycled paper, and 1/3 comes from textiles.51 You can recycle nearly all your personal paper waste. What about clothes? I’ve tried composting rags and old jeans, but it didn’t work: the cloth decomposed too slowly. Until we design clothes for the home compost bin, we can find ways to opt out of buying new cloth, for example by exchanging used clothes with one another.
Buses, trains, and a transportation comparison
Riding Amtrak in coach class emits 0.14 kg CO2 per passenger mile.52 Long-haul buses (in this case, Greyhound) have about half the emissions of Amtrak: 0.07 kg CO2 per passenger mile.53
How the different travel options stack up is illustrated in Figure 9.5. For a given distance, carpooling four to a 50 mpg car emits less than taking the train, which emits less than a 50 mpg car (alone), which emits less than flying. Four people flying on a plane (in coach) emit 5 times the CO2 (and 14 times the short-term CO2e) as four people sharing a 50 mpg car. Keep in mind that we typically go many more miles in a plane than in a car, bus, or train. The average Amtrak ride, for example, is 218 miles.54
Trains still have potential for efficiency increases, and could run on renewable electricity. They therefore hold potential to become much more favorable relative to other modes of transport. But planes are already nearly as efficient as they can be.55
Everything else
The categories we’ve considered so far—flying, driving, food, residential electricity, natural gas, stuff, and waste—come to a total of 20 tonnes per year for the average American. But what about emissions sources outside of these categories, such as roads, buildings, hospitals, and non-residential electricity? If we know the total emissions, we can get a rough idea about these other emissions. According to the US EPA, in 2013 the US emitted a grand total of 7,700 million tonnes of greenhouse gases.56 Dividing by the US population, we find annual per capita emissions of 24 tonnes, 4 tonnes in excess of the total from our seven categories. This suggests that these other emissions amount to around 4 tonnes per person per year.

Low-energy living saves money
Changing to a low-energy lifestyle has saved my family thousands of dollars. We spend less than one-half what we used to on food, we buy far less gasoline and diesel, we spend less than $20 per month on electricity, and we save on air travel. We also see indirect savings, for example, from staying healthier.
By contrast, many of my friends have reduced their emissions by buying electric vehicles (EV), rooftop solar panels (PV), and other expensive equipment. While still out of reach for many, EVs are becoming more affordable. And I know folks who have saved $30 or $40 per month over their former monthly electric bills of $100 or more by “going solar.” Also, in my opinion, the embodied emissions payback times are impressively short. A new electric car represents seven tonnes of embodied CO2e emissions, equivalent to burning 700 gallons of gasoline,58 for an average payback time of about 1.5 years.58 Solar panels require three or four years to pay back their manufacturing emissions.60
The shopping option allows people to reduce their carbon emissions without changing their lifestyles. This is good in that it helps people get started easily. However, it comes from a consumer mentality which may be a barrier to going further. Instead of examining behaviors and changing themselves, shoppers rein- force a comfortable habit of consuming. Isn’t this a big part of why we’re in such a mess to begin with?61 The shopping option might be a step in the right direction, but it means even more stuff; if it changes mindsets, shopping does so only incrementally; and it’s out of reach for the vast majority of humanity.
I chose a no-cost, home-brewed path because I enjoy changing my lifestyle, spending less, and opting out of consumerism. Part of my experiment in low-energy living is to show that anyone can do it, regardless of income level.
Flying and the quest for sustainability
I know many people who strive to live sustainable lives. They eat raw vegan diets, use hand-crank juicers, and keep goats for milk and meat.
Yet the raw vegan flies from the US to Asia several times per year, and the goat keeper flies across the continent once per month for her business. As we’ve seen, their flights cast a long, unsustainable shadow over their other efforts. Why do many people who strive to be “green” nonetheless choose to fly frequently?
Part of the answer, I think, is that few people quantify the carbon impacts of their actions, so they don’t realize that their flying habit dominates their emissions. I certainly had no idea until I estimated it myself.
Estimate your own emissions
Here’s the recipe for connecting your daily actions to your emissions:57
- Planes: Multiply your annual miles flown in coach and first class by 0.8 kg CO2e and 1.5 kg CO2e, respectively, and add the resulting two numbers. (If you wish to exclude cloud, contrail, and ozone warming effects, use 0.3 kg CO2 per coach mile and 0.6 kg CO2 per first class mile, respectively.)
- Driving: For each vehicle you drove, estimate the miles driven and divide by the vehicle’s miles per gallon (mpg); this gives gallons of fuel burned. Then multiply by 11.3 kg CO2 per gallon of gas or 12.1 kg CO2 per gallon of diesel. Finally, divide by the average number of people in the vehicle.
- Intercity trains and buses: Multiply the miles you rode the bus in a year by 0.065 kg CO2 per mile. Multiply the miles you rode Amtrak in a year by 0.16 kg CO2 per mile.
- Natural gas: Find your household total annual gas usage from your utility bills (one therm is equivalent to 98 cubic feet or 2.8 cubic meters). Divide this by the number of people in your household, and multiply by 13 kg CO2e per therm.
- Food: Meat diet: 3,000 kg CO2e per year; vegetarian diet: 1,500 kg CO2e per year; vegan diet: 1,000 kg CO2e. If you get some fraction from your garden or from freeganism, reduce proportionally
- Electricity: Add up your annual household electricity usage in kWh (from your utility bills), divide by the number of people in your household, and multiply by 0.9 kg CO2e per kWh.
- Waste: 700 kg CO2e from food and yard waste (less 200 kg CO2e if you compost all food waste, less 200 kg CO2e if you compost all yard waste, less 300 kg CO2e if you get at least one-quarter of your food from freeganism); 150 kg CO2e from sewage (unless you practice humanure). 300 kg CO2e comes from paper waste (assuming you recycle paper and cardboard, otherwise it would be higher), and 300 kg CO2e come from textiles. If much of your clothes are secondhand, reduce your textile waste proportionally.
- New stuff: Estimate your annual spending on new goods and multiply by 0.5 kg CO2e per US dollar.
Knowing your emissions across these categorizes, and tracking them over time, will help you make informed decisions as you reduce your emissions.
Climate impact of everyday actions
School drop-offs: The majority of kids in the US arrive by private vehicle, and fewer than 15% walk or bicycle.<sup>62</sup> A family living 6 miles from school drives 24 miles per day for drop-offs, or 4,300 miles for a 180-day school year.<sup>63</sup> If they drive a typical (25 miles per gallon64) car, they burn 170 gallons of gas. This emits 1,950 kg CO2.
- Heating a house in Los Angeles: Our heater burns about 100 therms per year to heat our 1,400-square-foot house, about 1⁄3our annual natural gas consumption. This emits 1,300 kg CO2e per year.
- Drying laundry: One load emits 3.5 kg CO2e (includ ng gas and electricity). A household of four running three loads per week creates annual emissions of 550 kg CO2e.
- Showering: An average shower in the US uses 17 gallons of water.<sup>65</sup> To heat that water from 50°F to 107°F requires burning 0.083. therms of natural gas (8,300 Btu). In a year, this emits 380 kg CO2e
- Refrigerator: My fridge uses 1.5 kWh per day (as mea- sured with a widely available, twenty-dollar electric power meter), emitting 1.4 kg CO2e, or 500 kg CO2e per year. (Imagine all the refrigerators running over the world each emitting 1.4 kg CO2e per day.)
- Pilot light: The two always-on pilot lights in our house (oven and water heater) burn 77 therms of gas in a year, emitting 970 kg CO2e!66 An average pilot light emits a whopping 490 kg CO2e per year.
- Laundry: One load takes 0.2 kWh of electricity. Three loads per week on cold adds up to 30 kg CO2e per year. If we want hot water, we need to burn about 0.15 therms of natural gas to heat the 30 gallons.67 Over one year, this adds up to 300 kg CO2e. Heating the water causes 30 times as much impact as the electricity.
- Computer: I measured a MacBook Air with the power meter; it uses 34 W. I use a laptop about 8 hours per day; this comes to 100 kWh per year. Our home wireless modem uses 6 W continuously (53 kWh per year). Assuming dirty electricity, the total is 140 kg CO2e per year.
- Cell phone charger: With my phone charger plugged in, the power meter reads 0.0 W. This comes to less than 0.4 kg CO2e over the course of a year, possibly much less—insignificant. Let’s go after things that actually matter, like flying in planes.
The plane would have flown anyway. Right?
Often, I hear smart people attempt to rationalize their flying by claiming that the plane would have flown with- out them, so they’re responsible for little or none of the plane’s emissions. This is a fallacy. Instead, there are at least two logical ways to look at the question.
We have a group of passengers all flying on the same plane (for simplicity, let’s assume all the seats are identical coach seats). The plane generates some measurable and known quantity of emissions to make the trip. Each passenger chose to take the trip, bought a ticket, and sat on the plane. The passen- gers’ intentions and actions were equivalent, so we’d best assign the same emissions to each, dividing the plane’s emissions by the number of passengers.
The airline has a business algorithm which schedules planes, and (hypothetically) one of the passengers on the plane critically tipped the algorithm to schedule the flight. Some would argue that this passenger should be assigned most of the emissions from the flight, while the others should be assigned only the emissions needed to fly one additional passenger. But the critical passenger remains unknown, so our best option is to take the expected value, which is equivalent to dividing the plane’s emissions by the number of passengers.68
I think the answer to situations like these is simple, but also difficult to hear: don’t try to live in two places at once. If you have truly meaningful work overseas, dive into its core by living there. Chances are it will then become meaningful beyond your wildest dreams. As my friend Pancho Ramos-Stierle says, “If you want to serve people, you come and live with the people, and laugh with them, and cry with them, and eat with them.” And if you can’t bring yourself to make this dive, then serve the people in your neighborhood. There are plenty of people to serve within biking distance. It only takes a shift in your thinking to find them. We don’t need to get on airplanes to serve.
High-profile environmental leaders also tend to fly a lot. They feel that their efforts to solve global warming justify their huge footprints, and perhaps they’re right. Still, I can’t help wondering whether they’d be even more effective than they already are, if only they’d walk their talk and lead by example.
In Being the Change, I attempt to present facts as accurately as I can and, in so doing, to raise awareness a little bit. Awareness is the soil out of which change grows. In Chapter 10, I describe some slow-travel alternatives that replaced my own flying habit. It took me about two years to change; I, too, was once addicted to flying.
If you choose flying, go forth and fly. But please don’t pretend your life is sustainable.
Why carbon offsets don’t work
The idea behind carbon offsets is to pay some company a modest sum (around $30 for a transatlantic flight) to “offset” the carbon emission of the flight by planting trees.69 Unfortunately, this simply doesn’t help.
First, carbon offset companies, whether well-intentioned or not, can’t guarantee that the trees they plant (assuming they plant any) will be allowed to grow undisturbed for centuries, or that a compensating mass of trees won’t be cut down somewhere else on the planet. How could they? They can’t even guarantee they’ll be in business in two years.
But suppose the offset companies could somehow magically guarantee they’d protect the trees for the next 1,000 years, even in the face of massive development pressure from our exponentially growing population. Even so, the scheme still wouldn’t work.
As mentioned in Chapter 3, a bit less than 1/3 of our cumulative emissions from 1750 to 2011 were from deforestation, while 2/3 were from burning fossil fuels. Suppose we planted so many trees that we reforested the planet to 1750 levels. (It’s hard to see how we could—even a mere 7.5 billion hungry humans destroy forests at a rate of 90,000 acres per day,70 whereas world population is forecast to grow to 11 billion by 2100. But suppose we did.)
By definition, this reforestation would recapture the cumula- tive emissions from deforestation. But fossil fuel emissions would remain.71 To draw those down as well, we’d need to keep planting trees—three times what we’d need to plant to get back to the 1750 reforestation, which was already implausible.
To look at it another way, all of the trees we could possibly plant are already spoken for by the carbon we’ve already emitted. Suppose we’ve already emitted 100 units of carbon (the numbers here are meant to be illustrative), and that we now stop emitting and reforest as much as we can. Suppose this best-case reforesta- tion captures 30 units. Afterwards, 70 units remain at large.
What if, instead of stopping immediately, we all took a few more flights and bought offsets? Now we’ve emitted, say, 101 units. The offsetting company plants some trees. But these trees would have been planted anyway in the best-case reforestation, which still captures only 30 units. But now 71 units remain at large instead of 70.
If buying carbon offsets locked fossil fuel emissions perma- nently back underground from whence they came, I’d be all for it. But they don’t.
People often argue that while offsets aren’t perfect, at least they’re doing some good. But are they? Offsets allow people to assuage their guilt and continue flying. In other words, offsets may ultimately increase CO2 emissions.72 We should certainly plant all the forests we can plant, but this should never be an excuse to
continue burning fossil fuels.
Accepting my intertwined-ness
Despite my efforts to transform my daily actions, I’m still involved in the project of industrial civilization. I use roads, I shop at super- markets, and when my children are injured, I’m grateful for the emergency room. I also had a few decades of emitting much more than I do now.
Nonetheless, two facts stand out from my ongoing experiment in low-energy living: I was able to make changes to my life that cut my global warming impact by well over a factor of ten, and these changes made me happier. From these facts, I draw the following two conclusions.
First: if everyone—especially those of us who live in affluent societies—made a conscious effort to move toward low-energy living and to change the collective mindset (and the collective infrastructure), we could quickly and painlessly cut global emissions in half, and with that momentum, we’d probably go much deeper. I’m a busy suburbanite with a demanding job, two small kids, and a wife who also works; the fact that I could easily make such deep emissions cuts means that you could likely do so, as well.73 If we all changed together, I’m certain that we’d amaze ourselves with our collective power.
Second: consuming less, and emitting less, makes me happier. Realizing this truth requires a shift in mindset, but it’s a shift more and more people are making. My own experiments, and the simi- lar experiments of many others, send a deeply optimistic message: we don’t need to fear the end of fossil-fueled industrial civilization. Instead, we can embrace this change, and help it come into the world.
1. In 2012, Bangladeshi per capita emissions were 1.2 tonnes CO2e (1.0 tonnes CO2e excluding land-use change), according to the World Resources Institute, CAIT Climate Data Explorer. [online]. cait.wri .org/historical.
2. There is one change I’d probably roll back, to a degree, if global warm- ing suddenly, magically, disappeared: I’d fly occasionally, though far less than I did before I reduced. Still, overall I’ve gained more than I’ve sacrificed by giving up flying.
3. Charles Eisenstein discusses the story of separation and the importance of kindness in: Charles Eisenstein. The More Beautiful World Our Hearts Know Is Possible, 3rd ed. North Atlantic, 2013. Kindness is necessary but it’s not sufficient: we also need to rapidly reduce our greenhouse gas emissions.
4. Here, I’ll use the mass of CO2 as opposed to the mass of carbon: 3.67 kg CO2 contains 1 kg of carbon (the oxygen atoms add mass). In other parts of the book, I may give quantities as the mass of carbon (e.g., GtC in Chapter 3). Also, I’ll round numbers to what I think is a reasonable degree of precision. In cases where I don’t give uncertainty explicitly, the uncertainty estimate can be inferred from the numerical precision. For example, 120 implies more uncertainty (roughly 10%) than 121 (roughly 1%). However, I reserve the right to give an extra digit of precision if I feel that omitting it would bias a comparison or calculation.
Be aware that various analyses of greenhouse gas emissions use different methods and make different assumptions. Be careful
to assess the assumptions underlying any given analysis. If these assumptions aren’t clear, or if the underlying methodology or sources of information aren’t clear, be wary of the conclusions.
5. Upstream emissions add an additional 28% [24%–31%] for gasoline, 20% [15%–25%] for diesel, 21% [17%–24%] for jet fuel, and 15% [9%–20%] for natural gas. See US EPA Greenhouse Gas Emissions from the U.S. Transportation Sector: 1990–2003. Office of Transportation and Air Quality, 2006, Table 14.1. [online]. nepis.epa.gov. These up- stream emission estimates only consider CO2 emissions; we will see below that methane emissions from natural gas production are also significant.
6. NO and NO2 which form ozone, a greenhouse gas, in the upper troposphere.
7. The mean of the IPCC’s estimates of the European average emission rate (short haul) and the rate for a 747 with 70% occupancy average over a 7,500-mile trip (long haul) is 0.30 kg CO2 per coach passenger mile. However, the mean of the EPA’s estimates for long and short flights is 0.21 kg CO2 per coach passenger mile. I average the IPCC and EPA estimates and then factor in upstream emissions of 21%.
8. David J. Unger. “First-class ticket: More legroom, more emissions.” Christian Science Monitor, June 17, 2013. [online]. csmonitor.com /Environment/Energy-Voices/2013/0617/First-class-ticket-more -legroom-more-emissions.
9. Christian Azar and Daniel J. A. Johansson. “Valuing the non-CO2 climate impacts of aviation.” Climatic Change 111 (2012). doi:10.1007 /s10584-011-0168-8.
10. Worldwatch Institute. Vital Signs 2006–2007: The Trends That Are Shaping Our Future. Norton, 2006, p. 68.
11. Or 2,500 kg CO2e if we include non-CO2 effects (via a multiplicative factor of 2.5).
12. Domestic and international carriers at all US airports tallied 1.3 tril- lion revenue passenger miles in 2015: US DOT, Bureau of Transportation Statistics. “Passengers—All Carriers—All Airports.” [online]. transtats.bts.gov/Data_Elements.aspx?Data=1. US population in 2015: 321 million: US census. [online]. census.gov/popclock. This leads to a very rough estimate that ignores foreign travelers in the US, and US travelers in foreign countries.
13. I actually love the act of flying itself. As a boy, the National Air and Space Museum’s brilliant 1976 film To Fly! utterly captivated me. I’d make my parents take me to see it each spring during our Easter road trip to Washington, DC to visit my grandparents. During college I learned how to fly sailplanes—small high-performance planes without engines that can soar on updrafts to heights of 50,000 feet— soloing, obtaining my license, and eventually wooing Sharon with soaring flight.
14. I discuss my transition to slow travel in Chapter 10.
15. US per capita vehicle miles of travel in 2013 was 9,400 miles: Chris McCahill. “Per capita VMT drops for ninth straight year: DOTs tak- ing notice.” State Smart Transportation Initiative, February 24 2014. [online]. ssti.us/2014/02/vmt-drops-ninth-year-dots-taking-notice/. The average fuel economy of cars on the road in 2013 was 21.6 miles per gallon: US DOT. “Average Fuel Efficiency of U.S. Light Duty Vehicles.” Bureau of Transportation Statistics, Table 4-23. [online]. ita.dot.gov/bts/sites/rita.dot.gov.bts/files/publications/national _transportation_statistics/html/table_04_23.html.
16. This term originated in her poem, “Leave.”
17. Burning a gallon of gas or diesel releases 8.9 and 10.2 kg CO2, re-
spectively: US Energy Information Agency. “Voluntary Reporting of Greenhouse Gases Program Fuel Emission Coefficients,” Table 2. [online]. eia.gov/oiaf/1605/coefficients.html#tbl2. I’ve then added upstream emissions of 28% for gasoline and 20% for diesel (these are 2015 values; upstream emissions may increase over time).
18. The industrial agricultural processes used to grow this crop do result in fossil emissions (that is, CO2 molecules made from carbon that had previously been locked safely underground). However, because I’m using a waste product, I don’t count these emissions.
19. To calculate this figure: my commute was 6 miles each way, and at first, I rode it on a 35-mpg motorcycle.
20. Patrick McGeehan et al. “Beneath cities, a decaying tangle of gas pipes.” New York Times, March 23, 2014. [online]. nytimes.com /2014/03/24/nyregion/beneath-cities-a-decaying-tangle-of-gas -pipes.html.
21. The composition of raw natural gas varies among gas fields, ranging between 70% to 90% methane, with the bulk of the remainder being ethane (an insignificant contributor to global warming), rounded out by small amounts of propane, butane, nitrogen, helium, CO2, and various impurities. Refined natural gas—the gas delivered to your home—is nearly 100% methane: Natural Gas Supply Associa- tion. “Natural Gas: Background.” [online]. naturalgas.org/overview /background.
22. Drew T. Shindell et al. “Improved attribution of climate forcing to emissions.” Science 326 (2009) [online]. doi:10.1126/science.1174760. The uncertainty in these global warming potentials is 23%. Methane traps outgoing longwave radiation much more effectively than CO2, but remains in the atmosphere for a shorter time. Therefore, com- paring to CO2 requires picking a time horizon. For more detail, see Chapter 3.
23. Most analyses underestimate methane by using a global warming potential of only 25 (choosing the 100-year time horizon and an outdated estimate of methane’s impact). The choice of time horizon is subjective; I choose to use the average of the two conventional time horizons to avoid bias.
24. To estimate this: burning one therm of natural gas emits 5.3 kg CO2, and burning an energy-equivalent amount of coal emits 10 kg CO2. At a GWP of 65, 72 grams of methane has a climate impact equivalent to the difference, 4.7 kg CO2. But the methane in a therm of natural gas has a mass of 2 kg, and 0.072 kg/2 kg = 3.6%.
25. Robert W. Howarth et al. “Methane and the greenhouse-gas footprint of natural gas from shale formations.” Climatic Change 106 (2011). [online]. doi:10.1007/s10584-011-0061-5.
26. Anna Karion et al. “Methane emissions estimate from airborne mea- surements over a western United States natural gas field.” Geophysical Research Letter 40 (2013). [online]. doi:10.1002/grl.50811.
27. Interstate Natural Gas Association of America (INGAA). “Pipeline Fun Facts.” Natural Gas Facts, INGAA website. [online]. ingaa.org /Topics/Pipelines101/PipelineFunFacts.aspx.
28. Here’s how I estimated this. Roughly half of the natural gas produc- tion in the US comes from unconventional gas, most of which is recovered via fracking: American Petroleum Institute. “Facts About Shale Gas.” [online]. api.org/oil-and-natural-gas/wells-to-consumer /exploration-and-production/hydraulic-fracturing/facts-about -shale-gas. So I estimate a total methane leakage rate of 5%. One kg of CH4 combusts into 2.75 kg of CO2; from this we can estimate that the methane in one therm of natural gas weighs about 2 kg; the leakage amounts to 100 grams. At a GWP of 65 times CO2, this comes to 6.5 kg CO2e per therm.
29. Residential natural gas use in the US in 2014 was 5.1 trillion cubic feet (52 billion therms): US Energy Information Administration. “Natural Gas Consumption by End Use.” [online]. eia.gov/dnav/ng/ng_cons _sum_dcu_nus_a.htm.
30. A typical household of four would realize a natural gas reduction of about three tonnes CO2e per year by installing a solar hot water heater.
The average four-person household in the US uses about 70 gal- lons of hot water per day: Danny S. Parker et al. “Estimating Daily Domestic Hot-Water Use in North American Homes.” ASHRAE Transactions 121(2) (2015). [online]. fsec.ucf.edu/en/publications/pdf /FSEC-PF-464-15.pdf.
Heating this water requires about 230 therms of gas per year, assuming an efficient water heater (efficiency factor of 0.71): US Office of Energy Efficiency and Renewable Energy. “Energy Cost Calculator for Electric and Gas Water Heaters.” [online]. energy.gov /eere/femp/energy-cost-calculator-electric-and-gas-water-heaters-0. Burning 230 therms of gas emits 3,000 kg CO2e. Hot water energy use depends on climate as well as personal habits.
31. The system price tag was actually $9,000, but I received a $3,500 rebate from California and a 30% federal tax credit on the remainder. This seems like a lot of money just for hot water! Part of the problem is that the smallest available system was twice as big as what my fam- ily needs; it had an 80-gallon tank, whereas we’d been perfectly happy with a 40-gallon tank. It’s also more complicated than necessary; it uses a pump, whereas a thermosiphon would be simpler. Perhaps there’s commercial potential for a 40-gallon (or even 20-gallon) thermosiphon system. I looked into designing and building a DIY system, but it’s quite difficult and I didn’t have time.
32. Recall from Chapter 3 that N2O is a powerful greenhouse gas. The GWP20 (global warming potential on a 20-year horizon) of 1 kg of N2O is 270 kg CO2e.
33. The majority of this, over 80%, comes from agricultural production itself; the rest comes from such things as transportation, processing, and packaging: Natasha Gilbert. “One-third of our greenhouse gas emissions come from agriculture.” Nature News, October 31 2012. [online]. doi:10.1038/nature.2012.11708.
34. P.J.Gerberetal.Tacklingclimatechangethroughlivestock:Aglobal assessment of emissions and mitigation opportunities. UN FAO, 2013.
[online]. fao.org/docrep/018/i3437e/i3437e.pdf. (Note that the claim made by the documentary film Cowspiracy, that 51% of global emis- sions are from livestock, is incorrect.)
35. Peter Scarborough et al. “Dietary greenhouse gas emissions of meat- eaters, fish-eaters, vegetarians and vegans in the UK.” Climatic Change 125(2) (2014). [online]. doi: 10.1007/s10584-014-1169-1. A full 1/3 of food produced in the US is wasted, and these numbers include that waste. However, they assume a methane GWP of 25 and are therefore likely on the low side.
36. The Vegetarian Resource Group. “2016 National Poll.” [online]. vrg.org/nutshell/Polls/2016_adults_veg.htm.
37. This 1,000 kg CO2e does not include the methane emissions that I’m preventing by keeping this food out of the landfill, which amounts to an additional 1,000 kg CO2e.
38. In 2014, the total US generation was 4.1e12 kWh, with coal and natural gas generating 39% and 27% respectively (the rest was nuclear, hydro, and renewables): US Energy Information Administration. “Electric Power Monthly.” [online]. eia.gov/electricity/monthly/epm_table _grapher.cfm?t=epmt_1_1. This required 854 million short tons of coal and 88 billion therms of natural gas: US EIA. “Electric Power Monthly.” Data for December 2015, February 2016, full report, tables 2.1.A and 2.4.A. [online]. eia.gov/electricity/monthly. Since a therm of natural gas produces 12.6 kg CO2e (includes up- stream emissions and leakage), burning natural gas for electricity in 2014 produced 1.1 trillion kg CO2e. The mean emissions from burning a short ton of coal is about 2,640 kg CO2: US EIA. Carbon Dioxide Emission Factors for Coal.” [online]. eia.gov/coal/production /quarterly/co2_article/co2.html; this value was for 1992, and I apply an 8% upstream emissions factor to get 2860 kg CO2e per short ton: Paulina Jaramillo et al. “Comparative Life-Cycle Air Emissions of Coal, Domestic Natural Gas, LNG, and SNG for Electricity Genera- tion.” Environmental Science and Technology 41(17) (2007). [online]. doi:10.1021/es063031o. Burning coal for electricity in the US in 2014 thus generated 2.4 trillion kg CO2e. Dividing the total emissions (3.5e12 kg CO2e) by the total generated (4.1e12 kWh) and factoring in 6% transmission loss yields 0.9 kg CO2e per kWh: US EIA FAQ. “How much electricity is lost in transmission and distribution in the United States?” [online]. eia.gov/tools/faqs/faq.cfm?id=105&t=3.
39. In 2015, the average US household used 10,812 kWh: US EIA FAQ. “How much electricity does an American home use?” [online]. eia.gov/tools/faqs/faq.cfm?id=97&t=3. There are 2.5 people per US household: US Census Bureau, “Families and living arrangements,” Table HH-6. Average Population Per Household and Family: 1940 to Present. [online]. census.gov/hhes/families/data/households.html.
40. It costs an additional 3.5 cents per kWh.
41. Renewable electricity will soon be cheaper than fossil-fueled elec- tricity, but as I’ve explained, this hasn’t occurred yet for our house- hold. Two things that will accelerate this important transition are a revenue-neutral carbon fee (Chapter 14) and community choice aggregation (Chapter 15).
42. Lindsay Wilson. “Shrink your product footprint.” [online]. shrinkthat footprint.com/shrink-your-product-footprint. To test this, consider the Prius, which according to a detailed life cycle analysis embodies 9,000 kg CO2e: Samaras and Meisterling. “Life Cycle Assessment of Greenhouse Gas Emissions from Plug-in Hybrid Vehicles.” Since a new Prius costs about $24,000, its embodied emissions are about 0.4 kg CO2e per dollar—roughly equivalent to the rule of thumb.
43. In a year, the average American spends $2,200, $1,600, and $600 on home furnishings (including things such as towels and computers), clothes, and personal care products, respectively: ValuePenguin.com. “Average Household Budget in the US.” [online]. valuepenguin.com /average-household-budget. The same person spends $1,900 in one year toward buying a new car (see the next note). The total is $6,300.
44. To estimate that, on average, people in the US spend $1,900 per year on new cars:
a) 17.5 million cars and light trucks were sold in the US in 2015: Mike Spector et al. “U.S. Car Sales Set Record in 2015.” Wall Street Journal, January 5, 2016. [online]. wsj.com/articles/u-s-car-sales-poised-for -their-best-month-ever-1451999939.
b) The average price of a vehicle was about $34,000: Douglas A. McIntyre. “GM Able to Raise Average Car Price by 8%.” 24/7WallSt website, February 3, 2015. [online]. 247wallst.com/autos/2015/02/03 /gm-able-to-raise-average-car-price-by-8/.
c) The US population was 320 million in 2015: Robert Schlesinger. “The 2015 U.S. and World Populations.” US News and World Report, December 31, 2014. [online]. usnews.com/opinion/blogs/robert -schlesinger/2014/12/31/us-population-2015–320-million-and-world -population-72-billion.
45. Mike Berners-Lee. “What’s the carbon footprint of…building a house.” Guardian, October 14, 2010. [online]. theguardian.com/envir onment/green-living-blog/2010/oct/14/carbon-footprint-house. Note that our rule of thumb would suggest a price of $160,000 for this house, not including the price of the land, but our rule of thumb can’t account for large variations in regional real estate market.
46. The garbage you and I throw away is known as municipal solid waste (MSW). Interestingly, for every tonne of MSW thrown out in the US, there are 40 tonnes of waste created upstream. Ninety-four percent of US waste is industrial (discards from manufacturing, mining, metals processing, fossil fuel procurement, and agriculture), 3.5% is from construction and demolition, and 2.5% is MSW: Annie Leonard. The Story of Stuff: The Impact of Overconsumption on the Planet, Our Communities, and Our Health—And How We Can Make It Better. Free Press, 2011, p. 186.
47. In 2014, landfills in the US generated 6.6 billion kg of methane: US EPA. “Inventory of U.S. Greenhouse Gas Emissions and Sinks: 1990– 2014.” Table 7-2. [online]. epa.gov/sites/production/files/2016-04 /documents/us-ghg-inventory-2016-chapter-7-waste.pdf. Multiply- ing by our mean GWP of 65 and dividing by 320 million Americans yields 1,300 kg CO2e per person. Of our organic waste, 35% is food waste (500 kg CO2e), 25% is wood pulp (300 kg CO2e), 25% is textiles (300 kg CO2e), and 15% is yard waste (200 kg CO2e): Percentages calculated from ibid., Table 7-6.
48. World Resources Institute. CAIT Climate Data Explorer.
49. In 2000, producing the electricity to run US sewage treatment plants emitted 15.5 megatonnes of CO2e: Center for Sustainable Systems. “U.S. Wastewater Treatment Factsheet.” University of Michigan Pub No. CSS04-14, 2016. [online]. css.snre.umich.edu/sites/default/files/U.S._Wastewater_Treatment_Factsheet_CSS04-14.pdf. Public waste water treatment plants in the US emitted an additional 38 megatonnes CO2e from methane: EPA. “Inventory of U.S. Green- house Gas Emissions and Sinks”; I’ve scaled this to a methane GWP of 65. About 2/3 of sewage treatment emissions are from domestic wastewater. The rest is from industrial sources, mainly meat produc- tion (76%) and paper manufacturing (17%): EPA. “Inventory of U.S. Greenhouse Gas Emissions and Sinks,” Table 7-18.
50. Of the organic material that goes into US landfills, 35% is food, 25% is textiles, 25% is paper, and 15% is yard waste: EPA. “Inventory of U.S. Greenhouse Gas Emissions and Sinks.” Assuming these mate- rials produce methane at similar rates when they decompose, they produce 500 kg CO2e, 300 kg CO2e, 300 kg CO2e, and 200 kg CO2e, respectively. Composting the yard waste and one-third of the food waste (the post-consumer food waste) therefore prevents 400 kg CO2e of methane emissions.
51. These estimates were derived from data in: EPA. “Inventory of U.S. Greenhouse Gas Emissions and Sinks.” See previous note.
52. In 2014, Amtrak used 2,200 Btu of energy per passenger mile: Stacy C. Davis et al. Transportation Energy Data Book, ed. 35. Oak Ridge Na- tional Laboratory, Pub #ORNL-6992, 2016, Table 9.10. One gallon of diesel has 137,000 Btu: US EIA. “Energy Explained.” [online]. eia.gov /energyexplained/index.cfm/index.cfm?page=about_energy_units. The combustion of this fuel creates 12.1 kg CO2, which means in 2014 Amtrak emitted 0.19 kg CO2 per passenger mile. Assuming that 2/3 of the passengers are in coach and that they take 1/2 the space of sleeper car passengers (approximately true for the Coast Starlight train) and are therefore responsible for 1/2 the emissions means Amtrak train travel emits 0.14 kg CO2 per coach passenger mile and 0.28 kg CO2 per sleeper passenger mile.
53. 184 passenger miles per gallon of diesel: Amy Zipkin, “Smoothing the rides on greyhound,” New York Times, May 17, 2008. [online]. nytimes.com/2008/05/17/business/17interview-long.html.
54. Davis et al. Transportation Energy Data Book, Table 9.10.
55. David J.C. MacKay. Sustainable Energy: Without the Hot Air. UIT, 2008, the chapter entitled “Planes II.”
56. EPA. “Inventory of U.S. Greenhouse Gas Emissions and Sinks.” They use a methane GWP of 25; for consistency with this book, I’ve scaled their methane estimate to a GWP of 65 by multiplying it by a factor of 2.6.
57 Calculation values and factors are based on US data. If you rent, you might need to coordinate with your landlord to estimate electricity and natural gas usage.
58. Anders Nordelöf et al. “Environmental impacts of hybrid, plug-in hybrid, and battery electric vehicles: What can we learn from life cycle assessment?” International Journal of Life Cycle Assessment 19(11) (2014). [online]. doi:10.1007/s11367-014-0788-0. Note that gas cars are estimated to have five tonnes CO2e of embodied emissions, but this estimate will vary greatly depending on the size of the vehicle.
59. Recall that the US per capita vehicle miles of travel in 2013 was 9,400 miles, and that the average passenger vehicle on the road in the US in 2013 gets 21.6 miles per gallon. Therefore, the average vehicle burns 700 gallons of gas after 1.6 years.
60. National Renewable Energy Laboratory. “PV FAQs: What is the energy payback for PV?” [online]. nrel.gov/docs/fy05osti/37322.pdf. With an expected lifetime of 30 years, though, this is still a good deal.
61. As I explained in Chapter 5, roughly one-half of global emissions growth comes from growth in consumption. The other one-half comes from population growth.
62. For 2009, for children aged 5–15 yrs: Nancy McGuckin. “Travel to School in California: Findings from the California—National Household Travel Survey.” Prepared for Active Living Research, Bikes Belong Foundation, and the Safe Routes to School National Partner- ship, 2013, p. 13. [online]. travelbehavior.us/Nancy-pdfs/Travel to School in California.pdf.
63. One parent I know drives 20 miles each way—five tonnes of CO2 and thousands of dollars in fuel costs for getting her kids to school! Hav- ing a uniformly strong public education system, with good schools in every neighborhood, isn’t just good for our kids and for the future of the US, it’s also good for the climate.
64. The US average fuel consumption of model-year 2008 vehicles sold (as opposed to on the road) was 20.8 miles per gallon; in 2016, it was 25.1 mpg.: University of Michigan Transportation Research Institute. [online]. umich.edu/~umtriswt/EDI_sales-weighted-mpg.html. I have used a value of 24.7 mpg in my calculations. Changes in average fuel consumption are driven by gasoline prices, although there is likely a lag time between gasoline price shifts and sales of larger vs. smaller vehicles.
65. Alliance for Water Efficiency. “Showering to Savings.” [online]. home-water-works.org/indoor-use/showers.
66. Estimated as follows:
(1) I took a baseline measurement with just the pilot lights running. (I turned the hot water heater to “vacation” mode so it wouldn’t switch on.) After 65 minutes, 1.7±0.05 cubic feet had elapsed, a rate of 1.6 cubic feet per hour. (The uncertainty comes from my time measurement; I don’t know the uncertainty in the meter.) This amounts to 38±1 cubic feet per day, about 0.4 therms.
(2) I turned off the heater pilot light. With the other two pilot lights running, the meter elapsed 0.85±0.05 cubic feet in one hour (77 therms per year). So the heater pilot light had been accounting for 1/2 of the instantaneous total, but we run this pilot less than 1/2 the year. Averaging the two always-on pilots, I estimate that a typical pilot emits 460 kg CO2e per year.
67. Suppose we want to heat 30 gallons of water from 60°F (16°C) to 120°F (49°C). It takes 8.33 BTU of thermal energy to raise 1 gallon of water 1°F, so our load requires 15,000 BTU. Burning 1 therm of natural gas yields 100,000 BTU, so our load requires burning 0.15 therms of natural gas, which releases 2 kg CO2e.
68. Thanks to Parke Wilde for these arguments.
69. This tree planting option is likely a best-case scenario. For example, a company called Terrapass has several projects it suggests it will spend your money on. One Terrapass project (which I picked at random from their website) aims to provide a small amount of habitat for migratory birds in California. While this sounds like a nice project in its own right, it doesn’t remove CO2 from the air. A secondary aim of this project is to provide “an important new revenue stream for rice growers.” Well, setting aside the fact that we shouldn’t be growing water-intensive rice in drought-stricken California in the first place, or the fact that conventional rice agriculture is a significant source of methane, could providing revenue to industrial agriculture corpora- tions (with their large carbon footprints) really offset the flights of Terrapass’s customers?
70. Hunt and McFarlane. “‘Peak soil.’”
71. The Earth’s biomass contains 450–650 GtC, mostly in trees. But by2015, humans had emitted 560 GtC from burning fossil fuels. To deal with this by planting trees, we’d have to add an additional global forest approximately equal to all the trees alive today, in addition to the re- forestation to the 1750 state. Where would we put all those extra trees?
72. Elisabeth Rosenthal. “Paying more for flights eases guilt, not emis- sions.” New York Times, November 17, 2009. [online]. nytimes.com /2009/11/18/science/earth/18offset.html.’
73. “Easily” here does not mean “trivially.” During the four-year period in which I was developing my methods, it was like having a moderately intense hobby. After this initial period, it became easy to maintain.